The states where people have lived in the same house the longest, and the ones where people are on the move
Spokeo reports that U.S. household mobility hit a record low in 2024, with only 11.2% relocating.
Press Release Disclaimer: This is a press release distributed through the XPR Media network. It has not been independently verified by our newsroom.



Sean Pavone // Shutterstock
The states where people have lived in the same house the longest, and the ones where people are on the move
In the last few years, something remarkable has been happening in American neighborhoods. More people are staying put.
In 2024, just 11.2% of U.S. households relocated, the lowest mobility rate since the Census Bureau began tracking the measure in 1948. That works out to about 14.8 million households changing addresses, which is a fraction of the movement seen even a decade ago.
The trend isn’t universal across the country, however. In West Virginia and Pennsylvania, households spend well over a decade in the same home.
In contrast, residents in states like Nevada, Colorado, and Texas have lived in their homes for less than five years. Spokeo has examined data from the Census Bureau, in conjunction with supporting data from Harvard and Axios, to reveal the states that see households with the longest and shortest tenures.
There are many reasons one family may choose to leave a home while another may stay, but affordability remains a top factor. Nationwide, as of early 2025, home prices have climbed 60% since 2019, and existing home sales fell to their lowest level since 1995 in 2024, according to the Joint Center for Housing Studies at Harvard.
Add in the fact that mortgage rates were hovering around 6.7% at the time of the Census data collection in 2024, and it’s clear to see that the math just isn’t working for many would-be sellers.
Homeowners who refinanced at rock bottom pandemic-era rates also face a stark trade-off. They could choose to keep their current mortgage or sell and take on a new loan at a much higher rate. The decision to stay resulted in about 320,000 fewer moves in 2024, according to Harvard data. The result is a housing market where inventory is locked up, and the median length of homeownership is increasing.
The 50-state ranking: Who stays, who goes
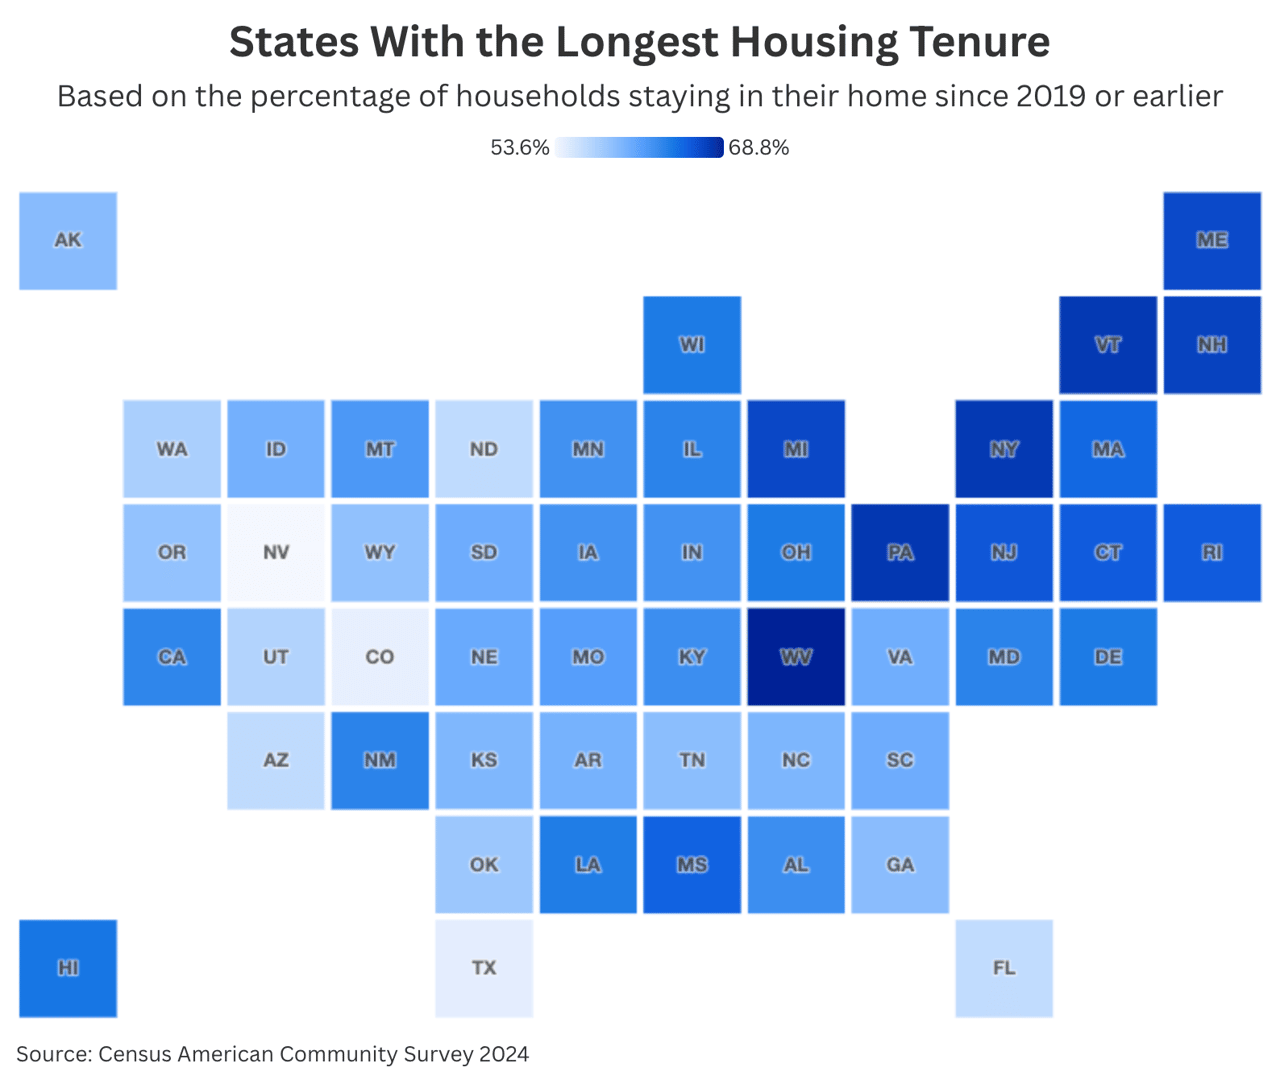
Two key data sources from the Census, Median Year Structure Built and Tenure by Year Householder, help identify the states with the longest housing tenures:
Spokeo
The map shows that the country is almost split in half. States across the Appalachian region and the Northeast all cluster at the top of stability rankings. West Virginia had the highest share of households that have lived in the same home since 2019, followed closely by Pennsylvania, Vermont, and New York, which were all above 67%.
New Hampshire, Michigan, Maine, New Jersey, Connecticut, and Rhode Island help to round out the top 10. In these states, more than two-thirds of households have converted into long-time residents.
Top 10 vs. bottom 10: The extremes
These are the 10 states where residents have remained since 2019:
1: West Virginia (68.8%)
2: Pennsylvania (68.1%)
3 (tie): Vermont (67.9%)
3 (tie): New York (67.9%)
5: New Hampshire (67.6%)
6: Michigan (67.4%)
7: Maine (67.3%)
8: New Jersey (66.9%)
9: Connecticut (66.7%)
10: Rhode Island (66.7%)
These are the 10 states where households have turned over the most since 2019 or earlier.
1: Oregon (59.4%)
2: Oklahoma (58.9%)
3: Washington (58.1%)
4: Utah (57.6%)
5 (tie): North Dakota (56.8%)
5 (tie): Arizona (56.8%)
7: Florida (56.7%)
8: Texas (54.6%)
9: Colorado (54.4%)
10: Nevada (53.6%)
While the percentages may not look far apart, the gap between the most and least stable states is certainly wide enough to reshape entire local economies. Roughly 15 percentage points separate the top from the bottom, which means a household in West Virginia is far more likely to have decades of equity built up compared to someone in Nevada.
The ‘Why’: 3 regional storylines
There are three distinct stories that help further explain the heatmap.
The first is Appalachia and the rural Northeast. West Virginia currently holds some of the highest homeownership rates in the country, mainly driven by cheap housing and residents with a desire to stay. Older households are driving much of the trend, as mobility among homeowners aged between 65 and 79 fell 11% between 2019 and 2023, per the Federal Reserve Bank of Boston, which outpaces the decline in younger households.
The second storyline centers around the Sun Belt and Mountain West. States like Oklahoma and Colorado are still seeing anywhere from 13%-14% of residents moving in a given year, which is more than double some East Coast counterparts. The search for job growth, warmer weather, and a lower cost of living are all draws that drive migration even when movement in other parts of the country slows.
There’s something to be said for the quiet stability of the Midwest. States like Illinois, Minnesota, and Ohio all land in the middle of the pack. They aren’t booming with new arrivals, but residents aren’t as entrenched as in the Appalachian region either. They are a steady equilibrium of population growth with tenured homeowners.
Generational divide: Tenure by age cohort
The generational divide is a significant factor. Mobility among older homeowners has fallen, but young people aren’t moving in the other direction at the same rate.
The Federal Reserve Bank of Richmond detailed how the share of adults between 25 and 34 who are living with their parents climbed from 10% in 2000 to 15% in 2023. Even among renters and young homeowners, the affordability crisis means fewer are moving once they settle in.
What this means for housing, labor, and policy
A country where fewer people move is a nation where housing inventory is unpredictable and unstable. For buyers, that shapes what a house hunt actually looks like. A low-turnover state means thinner inventory and slower-moving competition, while a high-turnover state offers more listings but less predictability from one year to the next. Employers recruiting across state lines should factor in longer relocation timelines in the Northeast and Appalachia, where fewer homeowners are willing to sell. Policy response isn’t one-size-fits-all, though. In the Sun Belt and Mountain West, new home building is required to match quicker turnover, as opposed to the former region, where incentives are required to get existing homes back on the market. Treating the 11.2% relocation figure as a single national number misses the true point: The real housing story and real fixes will play out state by state.
This story was produced by Spokeo and reviewed and distributed by Stacker.